Lease or buy in Austin
What the Austin office market looks like heading into 2027, and whether Quillfield should lease, buy, or buy and later sell with a lease back.
Buy with SBA 504, then sell with a leaseback. Bought and held, owning only ties leasing.
A year-5 sale-leaseback costs $0.48M less than leasing over ten years, after tax, because an investor prices the building on Quillfield's lease: about $351 a foot, against about $215 from an owner-user. Held to a vacant sale in 2037, buying saves only $0.02M. The catch is a 15 to 20 year lease; if Quillfield cannot commit that long, lease.
Lease
- Headcount could move enough that a long commitment is a guess
- Owner-user values stay flat: buying and holding then loses $358K
- Quillfield may leave before year 10: every shorter stay favors leasing
Buy and hold
- Owner-user values grow 2.4% a year or more (we use 2.5%)
- Quillfield stays ten years or longer
- It sells with a lease in place: the saving rises to $1.06M
Buy, then sale-leaseback
Recommended- Quillfield will sign a 15 to 20 year leaseback
- An investor pays a cap rate under 9.2% in year 5
- It would rather take its cash out than carry 2030s office values
July 2027 to June 2037. Lease at $42.00 full service, 8 months free, $80 allowance. Purchase at $190 a foot plus fit-out, 10% down. Buy and hold sells vacant to an owner-user at $243 a foot in 2037; the sale-leaseback sells to an investor at 8.0%. Lower is better. HoverTap a path for detail.
About a quarter of the market is empty, and it has stopped getting worse.
The spread is mostly definitional. Cushman & Wakefield, JLL and Avison Young track a smaller competitive inventory (66 to 75 MSF); Newmark and Partners count 83 to 87 MSF, including more small, older and owner-occupied buildings. A 20,000 SF tenant shops the competitive set, so we use 25.8% to 26.9%.1,2,6,8
New supply has nearly stopped. Rents are holding. Building prices have reset.
The counts differ on what they include. JLL's total carries Apple's owner-occupied buildings; the Newmark and Partners counts appear to leave out Waterline, 715,005 SF delivering in 2026 with no tenants signed. Competitive speculative supply is about 0.7 MSF.3,2,15 Deliveries were 151,190 SF in Q2 2026 against about 14 MSF delivered from 2020 to 2025.8,16
Rents are flat to slightly up: Cushman & Wakefield +3.3% and CBRE +3.5% over the year. Newmark expects landlords to hold asking rents flat or trim them.1,5,8
Nine developments that set the terms for a 2027 decision.
Absorption turned positive
JLL counts +205,700 SF and its third straight positive quarter; CBRE +324,000; Newmark +552,541. Cushman & Wakefield is still at −153,724 because it counts move-ins.3,5,8,1
The pipeline hit a multi-year low
1.7 MSF under construction against more than 3.5 MSF in mid-2024. Waterline, 715,005 SF, delivers in 2026 with no tenants signed.3,15
The sublease overhang is shrinking
From 4.4 to 3.3 MSF. The Malin took 32,076 SF of Meta's space and a TERAFAB venture took about 112,000 SF at Seaholm; Indeed withdrew 118,000 SF.12,3,19
Users are buying the buildings
Austin Community College, the City of Austin, Round Rock ISD, Central Health, a church and Artivion bought at $97 to $233 a foot. Partners: users, not yield investors, are clearing deals.6,20,21,22,23
Downtown towers trade again
405 Colorado sold for $733.70 a foot and One Eleven Congress for $401. 515 Congress appraised 22% below its 2022 value before it sold; 823 Congress also traded.24,25,26,27,28
SB Energy took the biggest block
It bought the 1.2 MSF former 3M campus for R&D, removing the market's largest available block.29,11,10
Large requirements are back
13 requirements over 100,000 SF, up from 9; CBRE counted 110+ tenants seeking 4.4 MSF. NXP leased 230,000 SF and PNC 140,000; Apollo named Austin a hub.3,30,2,31,32
Seven numbers the reports disagree on, and the one we use.
| Metric | Range across published reports | Figure we use | Why |
|---|---|---|---|
| Total vacancy8,1,3 | 21.9%26.9% | 25.8% to 26.9% | JLL and C&W measure the competitive multi-tenant set this tenant shops. Newmark and Partners count more owner-occupied and Class B space. |
| Net absorption, H1 20263,8,1 | -154K+552K | +205,700 SF | Newmark and Partners are lifted by an owner buying a campus; C&W lags 1.2 MSF of signed leases. JLL sits between. |
| Asking rent, all classes8,3,2 | $44.42$53.76 | By class: A $54 to $61, B $36.64 to $40.91 | Averages swing with class mix and with whether sublease space is counted. We price by class and submarket. |
| Under construction3,5,8 | 0.151.67 | About 0.7 MSF speculative | JLL's figure carries Apple's owner-occupied buildings. Waterline is the competitive supply. |
| Sublease space6,1,12 | 1.803.40 | 3.3 to 3.4 MSF available | Vacant-only counts leave out space still occupied but marketed. Available space is what competes on price. |
| Sale price10,17,4,23,6 | $152$352 | $159 to $196 near our size | Yardi's average carries downtown towers at $401 to $734 a foot. Owner-user sales of existing buildings ran $97 to $233. |
| Cap rate10,43,44,45 | 6.5%7.9% | 7.1% to 7.9% single-tenant; we use 8.0% | The Austin average is a small multi-tenant sample. Sale-leaseback pricing turns on tenant credit and term. No Austin figure exists. |
Dots are individual reports; the coral band is the figure we carry into the analysis. HoverTap a dot for the source. Colliers, Transwestern, NAI and Lee & Associates did not publish accessible Q2 2026 Austin tables46, and Avison Young's latest is Q1 2026.
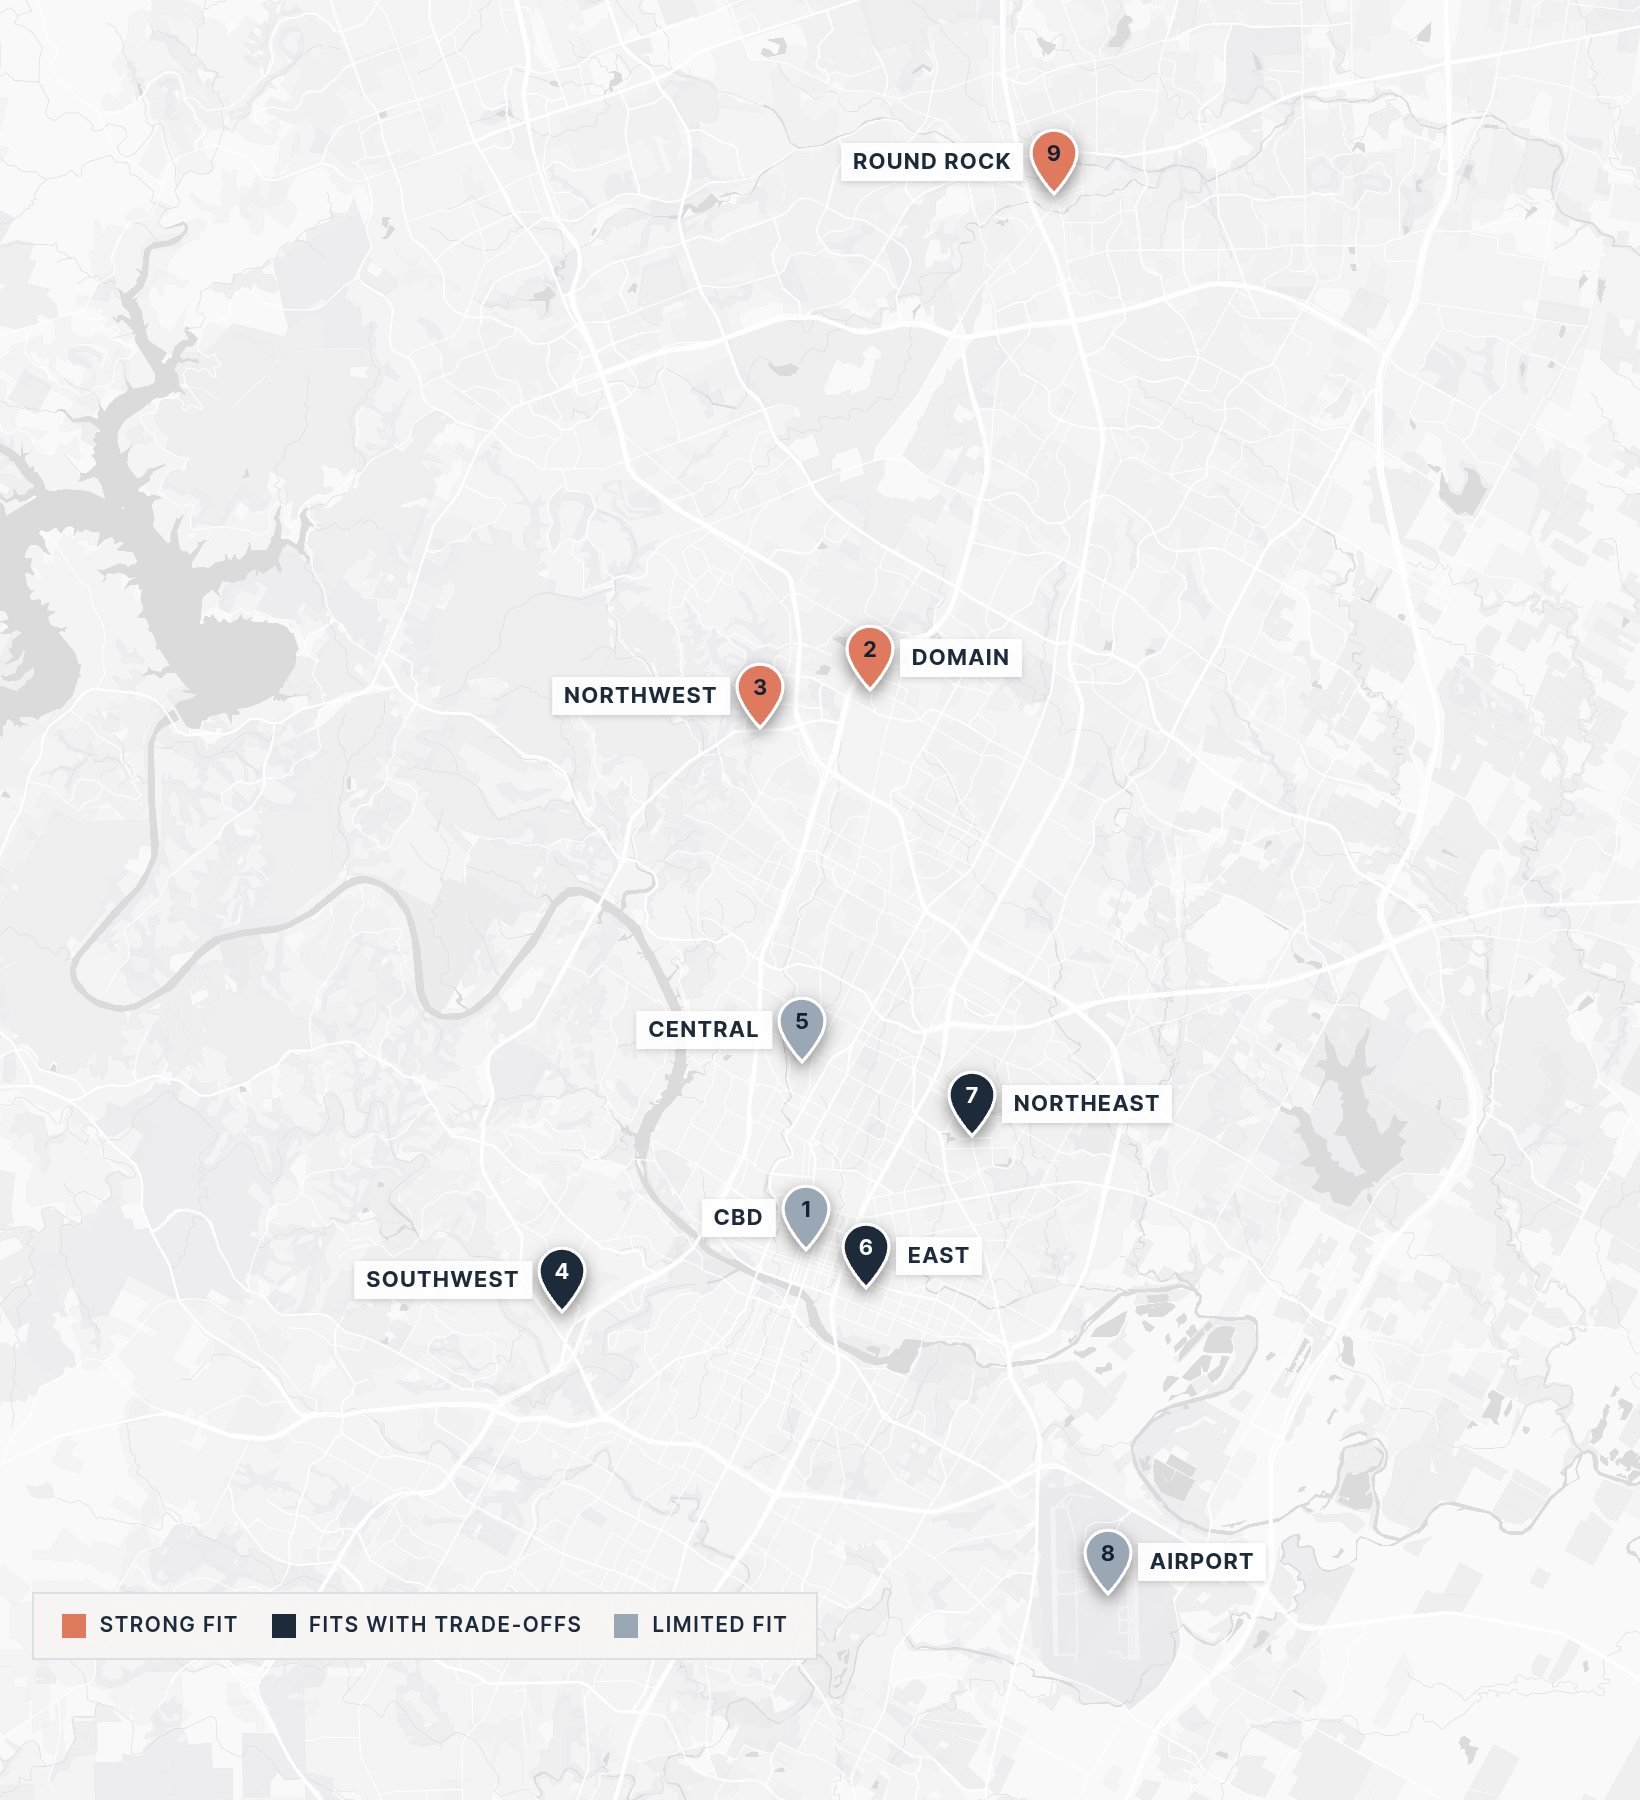
The northwest suits both paths, Round Rock a buyer, downtown only a lease.
| Submarket | Vacancy | Asking rent | Fit for Quillfield | |
|---|---|---|---|---|
| 1 | CBDHighest rents; Waterline's 715,005 SF delivers unleased; 1.28 MSF of sublet vacancy | 28.5% to 32.2% | $56.83 to $71.91 | Lease only1,6,8,2,3 |
| 2 | Domain / NorthTight by suburban standards; few small buildings trade | 14.9% to 17.1% | $40.79 to $44.94 | Strong to lease8,6,2 |
| 3 | Northwest / Far NorthwestMost owner-user sales near our size ($183 to $196.50); State Farm's 269,000 SF sublease | 16.1% to 32.3% | $35.42 to $45.00 | Strong both ways8,6,1,2,12 |
| 4 | SouthwestNo construction; Renesas took about 95,000 SF here in Q2 | 15.5% to 17.1% | $42.77 to $49.48 | Good to lease8,6,1,2,3 |
| 5 | CentralTightest close-in submarket; little space at 20,000 SF | 5.7% to 13.3% | $36.86 to $55.15 | Thin supply1,8,6,2 |
| 6 | EastAtlassian's 158,000 SF on the sublease market | 36.4% to 45.0% | $55.62 to $59.15 | Leverage to lease1,2,12 |
| 7 | NortheastArtivion bought two Anderson Lane sites at $97 and $159 a foot | 41.9% to 49.8% | $33.12 to $34.98 | Value buys1,6,2,23,47 |
| 8 | Southeast / AirportACC paid $233 a foot for Bergstrom Tech Center; Superior HealthPlan 215,000 SF sublease | 20.2% to 39.0% | $33.07 to $35.87 | Lowest rents1,2,48,12 |
| 9 | Round Rock / Cedar ParkTightest in Newmark and Partners data; combined tax rate 1.78 vs 2.05 per $100 in Austin (2025) | 8.2% to 22.7% | $35.14 to $37.93 | Strong to buy8,6,1,2,49,50,51 |
Ranges across four brokerages; rents full service. Pins are reference points.52 HoverTap a row to find it.
A tenant in this market can ask for a lot.
Landlords are carrying a quarter of the market empty. NAI reports concessions still elevated, keeping effective rents below asking; JLL calls them stable; Newmark expects the market to stay tenant friendly.53,3,8
3.3 to 3.4 MSF is offered, with eight blocks over 100,000 SF. Built-out sublease space can cut the fit-out bill and the move date.1,12
Leases in older buildings run five years or less; new buildings ask for ten.54 A lease carries no 51% occupancy rule and no building to sell if headcount moves. Information jobs fell 5.5% in a year.55,40
The pale bar is Quillfield's 20,000 SF. Any of these could be split.12,3
| Tenant | SF | Type |
|---|---|---|
| CelesticaDomain 3 | 33,081 | New8,1 |
| Alpha SchoolsMcGarrah-Jessee | 33,596 | Lease6 |
| The MalinSixth and Guadalupe | 32,076 | Sublease of Meta space3,8 |
| Texas Capital Bank415 Colorado | 27,012 | New3,1 |
| RyanColorado Tower | 24,532 | New8 |
Owner-users bought existing buildings for $97 to $233 a foot.
No closed sale of a 10,000 to 40,000 SF standalone office building with a published price was found: Texas does not require sale prices to be disclosed.64 The five largest 2025 sales, 1.46 MSF, and October's Lavaca Plaza sale closed without public prices.65,66 The closest in size are the GSA condo at $192 and Artivion's buildings at $159.
"Users, not yield-driven investors, are clearing deals."Partners, Q2 20266
Our $190 purchase price sits inside the range for buildings near the target size. Add $20 of base-building work and $136.77 of fit-out and the all-in cost is $351 a foot. An owner-user would pay about $243 in 2037 at 2.5% a year: the fit-out adds little resale value.
SBA 504 lets a 90-person firm buy with 10% down, at a blended 6.9% fixed.
What it costs to borrow
| SBA 504, 25-yearEffective, September 2026 pricing; debenture 5.41% | 6.54%67,68 |
| SBA 504, 20 and 10-yearNext pricing October 8, 2026 | 6.53% / 6.60%67,68 |
| SBA 7(a)Best case; prime 7.00% plus up to 3.0% on variable loans | 7.00%69,34,70 |
| Conventional owner-occupiedBest case; quoted range 6.43% to 9.53%, up to 85% LTV | 7.26%69,71 |
| 10-year TreasuryOctober 1, up from 4.26% to 4.34% in May | 5.24%34,72,35 |
Banks eased standards for this kind of loan slightly in Q2.81
Property tax per $100, Austin ISD area
| 2025 | 2026 | |
|---|---|---|
| City of Austin | 0.5240 | 0.579937,36 |
| Austin ISD | 0.9252 | 0.918473 |
| Travis County | 0.3758 | 0.386274,75 |
| Austin Community College | 0.1034 | 0.103676,77 |
| Central Health | 0.1180 | 0.132939,38 |
| Combined, per $100 | 2.0465 | 2.1210 |
$106K in year one on a $250/SF taxable value. Office values on the 2026 roll rose 9.8%, low-rise office fell 1.2%, and appeals cut 2025 office values 9.5%.82,83 Round Rock's combined 2025 rate was 1.78.49,50,51,84
Fit-out deduction
Qualified improvement property gets 100% bonus depreciation, now permanent: $2.74M deducted in year one.85,86,87 A cost segregation study can move more of the building into short lives.88
Building, a year
39-year straight line.85 The new production-property deduction excludes offices.89 Section 179 caps at $2.56M.90
Equity built
Principal repaid over ten years, recovered at a sale or refinance.
Own while it is cheap. Sell to an investor later and stay as the tenant.
| Base term | 15 to 20 years with renewal options, absolute net93; some advisors fit 10 to 1535 |
| Escalators | 48% of W. P. Carey's rent is on fixed bumps; its average remaining term is 12.0 years97 |
| Tax | The gain is taxable. Section 1031 can defer it only into other real property, within 45 and 180 days98,99 |
With Quillfield's lease in place, the building is worth about $351 a foot to an investor in year 5. Sold empty to an owner-user, about $215. A private, unrated tenant should expect the top of the cap range, so we use 8.0%.
A sale-leaseback releases less cash than the price suggests. Its value is the investor's price.
Savings against leasing, present value
By year of sale and the cap rate the investor pays. Blue favors the sale-leaseback; grey favors leasing. HoverTap for both costs.
Why the cash is small. 100% bonus depreciation on the fit-out front-loads the tax saving; a sale gives much of it back. In year 5, $0.62M of the $1.05M released goes to tax. The loans are still 91% outstanding.
When it wins. Against leasing and against buy and hold (sold empty to an owner-user at $243 a foot in 2037), in every case but a year-3 sale at 8.5% or more. Breakeven caps: 8.4% in year 3, 9.2% in year 5, 10.3% in year 7. The leaseback runs 15 to 20 years; rent is counted only to June 2037.
Owning costs about the same as leasing each year. How it ends decides it.
| Move-inJul 2027 | Yr 12027-28 | Yr 22028-29 | Yr 32029-30 | Yr 42030-31 | Yr 52031-32 | Yr 62032-33 | Yr 72033-34 | Yr 82034-35 | Yr 92035-36 | Yr 102036-37 | 10-year | PV at 8% | |
|---|---|---|---|---|---|---|---|---|---|---|---|---|---|
| Rent, full service | – | (280) | (865) | (891) | (918) | (945) | (974) | (1,003) | (1,033) | (1,064) | (1,096) | (9,070) | (5,824) |
| Fit-out above the allowance | (1,135) | – | – | – | – | – | – | – | – | – | – | (1,135) | (1,135) |
| Tax savings | – | 297 | 182 | 187 | 193 | 199 | 204 | 211 | 217 | 223 | 230 | 2,143 | 1,444 |
| After-tax cash flow | (1,135) | 17 | (684) | (704) | (725) | (747) | (769) | (792) | (816) | (841) | (866) | (8,062) | (5,515) |
| Move-inJul 2027 | Yr 12027-28 | Yr 22028-29 | Yr 32029-30 | Yr 42030-31 | Yr 52031-32 | Yr 62032-33 | Yr 72033-34 | Yr 82034-35 | Yr 92035-36 | Yr 102036-37 | 10-year | PV at 8% | |
|---|---|---|---|---|---|---|---|---|---|---|---|---|---|
| Down payment | (701) | – | – | – | – | – | – | – | – | – | – | (701) | (701) |
| Carry before move-in, 4 months | (258) | – | – | – | – | – | – | – | – | – | – | (258) | (258) |
| Debt service | – | (532) | (532) | (532) | (532) | (532) | (532) | (532) | (532) | (532) | (532) | (5,324) | (3,573) |
| Operating costs and property tax | – | (336) | (346) | (357) | (367) | (378) | (390) | (401) | (413) | (426) | (438) | (3,852) | (2,537) |
| Tax savings | 54 | 755 | 181 | 182 | 183 | 183 | 184 | 184 | 184 | 184 | 185 | 2,459 | 1,813 |
| Sold empty to an owner-user, after payoff and tax | – | – | – | – | – | – | – | – | – | – | (516) | (516) | (239) |
| After-tax cash flow | (905) | (113) | (697) | (707) | (717) | (728) | (738) | (750) | (761) | (774) | (1,302) | (8,193) | (5,495) |
| Move-inJul 2027 | Yr 12027-28 | Yr 22028-29 | Yr 32029-30 | Yr 42030-31 | Yr 52031-32 | Yr 62032-33 | Yr 72033-34 | Yr 82034-35 | Yr 92035-36 | Yr 102036-37 | 10-year | PV at 8% | |
|---|---|---|---|---|---|---|---|---|---|---|---|---|---|
| Down payment | (701) | – | – | – | – | – | – | – | – | – | – | (701) | (701) |
| Carry before move-in, 4 months | (258) | – | – | – | – | – | – | – | – | – | – | (258) | (258) |
| Debt service | – | (532) | (532) | (532) | (532) | (532) | – | – | – | – | – | (2,662) | (2,126) |
| Rent after the sale, net | – | – | – | – | – | – | (561) | (572) | (583) | (595) | (607) | (2,918) | (1,581) |
| Operating costs and property tax | – | (336) | (346) | (357) | (367) | (378) | (390) | (401) | (413) | (426) | (438) | (3,852) | (2,537) |
| Tax savings | 54 | 755 | 181 | 182 | 183 | 183 | 200 | 204 | 209 | 214 | 220 | 2,586 | 1,879 |
| Sale to an investor, after payoff and tax | – | – | – | – | – | 428 | – | – | – | – | – | 428 | 291 |
| After-tax cash flow | (905) | (113) | (697) | (707) | (717) | (300) | (751) | (769) | (787) | (806) | (826) | (7,379) | (5,033) |
| Move-inJul 2027 | Yr 12027-28 | Yr 22028-29 | Yr 32029-30 | Yr 42030-31 | Yr 52031-32 | Yr 62032-33 | Yr 72033-34 | Yr 82034-35 | Yr 92035-36 | Yr 102036-37 | 10-year | PV at 8% | |
|---|---|---|---|---|---|---|---|---|---|---|---|---|---|
| Lease | (1,135) | 17 | (684) | (704) | (725) | (747) | (769) | (792) | (816) | (841) | (866) | (8,062) | (5,515) |
| Buy and hold | (905) | (113) | (697) | (707) | (717) | (728) | (738) | (750) | (761) | (774) | (1,302) | (8,193) | (5,495) |
| Buy, then sale-leaseback | (905) | (113) | (697) | (707) | (717) | (300) | (751) | (769) | (787) | (806) | (826) | (7,379) | (5,033) |
| Buy and hold, against leasing | 230 | (131) | (14) | (3) | 8 | 19 | 31 | 43 | 55 | 67 | (436) | (131) | 20 |
| Sale-leaseback, against leasing | 230 | (131) | (14) | (3) | 8 | 447 | 18 | 23 | 29 | 34 | 40 | 683 | 482 |
After-tax cash flows, $ thousands; costs in parentheses. 20,000 SF, July 2027 to June 2037. Buy and hold's year-10 figure is the building sold empty to an owner-user at $243 a foot, less cost of sale, loan payoff and tax on the gain. Move-in includes 4 months of interest and operating costs while the space is built out. HoverTap the chart for each year.
Held to a vacant sale, buying is a coin flip. Rent, price or exit value can each move it $0.3M.
Coral: buying saves. Grey: buying costs more. Base case outlined: $190 purchase, sold empty for $243 a foot in 2037. The right-hand column is the price an investor would pay with an 8.0% lease in place. Loan-rate changes apply to both loans.
Against a $20K base saving, any one of these can flip it
Coral: the change that helps buying. Grey: the change that hurts it.
Three things decide it: the value at exit, how long Quillfield stays, and cash at move-in.
Buying only catches up at ten years. Every shorter stay favors leasing.
| Base | Breakeven | |
|---|---|---|
| Value in 2037 | $243/SF | $240/SF |
| Value growth a year | 2.5% | 2.38% |
| Purchase price | $190/SF | $191.27/SF |
| Lease rent, full service | $42.00 | $41.82 |
| Free rent on the lease | 8 months | 8.4 months |
| Loan rates | today | +0.06 pt |
| Discount rate | 8% | 6.4% |
Every breakeven sits next to the base case: held to a vacant sale, owning is a tie.
Most market risks argue for leasing, or for handing value risk to an investor.
| Risk | What it means | It favors |
|---|---|---|
| Waterline delivers 715,005 SF unleased | JLL expects vacancy to rise when it does.3,15 | Lease |
| Information jobs keep falling | Down 5.5% in a year; Newmark ties slower leasing to tech restructuring. Fewer heads, less space.40,8 | Lease |
| Sublease space stays high | 3.3 to 3.4 MSF, eight blocks over 100,000 SF. More cheap space for tenants.1,12 | Lease |
| Rates rise further | The 10-year Treasury passed 5% and the Fed raised in September. A 504 locks the rate at closing.34,33 | Lease, until closing |
| Tax rates and values climb | City and Central Health rates rose for 2026; the roll grew 5.48% with office among the drivers.36,38,100 | Lease |
| Office values fall again | US office values are 35% off the 2022 peak. Buy and hold carries the 2037 value: below $240 a foot, leasing wins. A sale-leaseback hands that risk to the investor.18 | Lease or sale-leaseback |
| Investors cool on office leases | Office fell to 14% of net-lease volume; sale-leaseback share is half its average. Above a 9.2% cap in year 5, the sale-leaseback loses to leasing.45,96 | Lease or buy and hold |
| Quillfield's headcount moves | Buy and hold needs about ten years to break even and a leaseback runs 15 to 20. Both assume roughly 20,000 SF in Austin for a long time. | Lease |
| Large tenants return | 13 requirements over 100,000 SF and 1.2 MSF signed but not yet occupied would tighten the market.3,1 | Buy |
| Concessions tighten | Free rent nationally fell from a record 9.6 months in 2023 to 8.9 in 2024. Less free rent widens the gap.101,102 | Buy |
"It favors" is the path the risk helps if it happens. The decision turns most on the firm's own headcount plan, which no market report covers.
Every input, and where it comes from.
8 of 33 inputs come straight from published sources and one from the client. The other 24 are our assumptions, set inside published ranges where they exist: rent, concessions, operating costs, financing terms, values and cap rates. Change any of them in the workbook.
Download the model (.xlsx)| Space and lease | ||
| Space requirement90 people at about 220 SF a head | 20,000 RSF | Client |
| Lease asking rent, year 1Inside Domain/North and Northwest ranges, $35.42 to $45.008,1,6,2 | $42.00 FSG | Assumption |
| Lease rent escalationFixed annual bump | 3% | Assumption |
| Free rent12-market average 8.9 months, 2024101 | 8 months | Assumption |
| Tenant improvement allowance12-market average $87.51, 2024101 | $80/SF | Assumption |
| Fit-out cost, second-generation spaceAustin $156.31/SF, less 12.5% for second generation | $136.77/SF | Sourced56 |
| Market rent growthC&W +3.3% in a year1; Newmark expects flat8 | 2.50% | Assumption |
| Owning costs | ||
| Operating costs excluding property taxNo Austin figure published | $11.00/SF/yr | Assumption |
| Capital reserve | $0.50/SF/yr | Assumption |
| Cost and tax-value growth | 3% | Assumption |
| Months owned before move-inMarch close to July move-in, interest only | 4 months | Assumption |
| Purchase and financing | ||
| Purchase priceComps near this size: $159 to $196.5023,59,6 | $190/SF | Assumption |
| Closing costs | 2% | Assumption |
| Base-building workRoof, HVAC, restrooms on an older building | $20/SF | Assumption |
| 504 senior bank loan50 / 40 / 10 structure | 50% | Sourced78,79 |
| 504 CDC debentureDebenture capped at $5.5M80 | 40% | Sourced78,79 |
| Owner equityAt least 10% (13 CFR 120.801) | 10% | Sourced78,79 |
| Bank rate, 504 first lienConventional best case69; range 6.43-9.53%71 | 7.26% | Assumption |
| 504 debenture rate, 25-yearSeptember 2026 pricing | 6.54% | Sourced67,68 |
| Amortization, both loansMatches the 25-year debenture67 | 25 years | Assumption |
| Property tax | ||
| Taxable valueBetween purchase price and all-in cost | $250/SF | Assumption |
| Property tax rate, 2026Five taxing units, Austin ISD area | $2.1210 per $100 | Sourced36,73,75,77,38 |
| Exit and sale-leaseback | ||
| Owner-user value todaySame comps, $159 to $196.5023,59,6 | $190/SF | Assumption |
| Owner-user value growthSet equal to market rent growth | 2.50% | Assumption |
| Cost of sale | 3% | Assumption |
| Sale-leaseback cap rateNational 7.1-7.9%43,44,45; higher for an unrated tenant | 8.00% | Assumption |
| Sale-leaseback rent escalation48% of W. P. Carey rent is on fixed bumps97 | 2% | Assumption |
| Sale-leaseback year (base case) | Year 5 | Assumption |
| Income tax and discounting | ||
| Federal income tax rateC corporation; franchise tax in every path103 | 21% | Assumption |
| Building share of price | 80% | Assumption |
| Building depreciation | 39 years | Sourced85 |
| Bonus depreciation on fit-out (QIP)Permanent after Jan 19, 2025 | 100% | Sourced85,86,87 |
| Discount rateClient's cost of capital | 8% | Assumption |
Terms. FSG: full-service gross rent, which includes operating costs and taxes. MSF: million square feet. Net absorption: the change in occupied space. bps: basis points, hundredths of a percent. CDC: the certified development company that issues the SBA 504 debenture, the 40% second loan. Qualified improvement property: interior work eligible for faster depreciation. Second-generation space: space built out by an earlier tenant.
Run both tracks now. Decide in February.
Meridian represents tenants and buyers only.
103 sources, numbered as cited.
- Cushman & Wakefield, MarketBeat Austin Office Q2 2026, Jul 2026 (Q2 2026 report).
- Avison Young, Austin Office market snapshot | Q1 2026, Apr 2026.
- JLL, Austin Office Market Dynamics, Office | Q2 2026, Jul 2026 (Q2 2026 report).
- Commercial Property Executive, Austin Office Pipeline Outpaces Peers (Yardi Matrix data), Sep 29, 2026.
- CBRE, Austin Office Figures - Q2 2026, Jul 9, 2026.
- Partners Real Estate, Austin Office | Q2 2026 | Quarterly Market Report (web page and PDF), Aug 18, 2026.
- CRE Daily, Austin Office Job Growth Surges as Vacancy Stays High, Jun 17, 2026.
- Newmark, Market Overview: Austin Office 2Q26, Jul 2026 (Q2 2026 report).
- The Real Deal, What to Expect in The Austin Office Market For 2026, Jan 19, 2026.
- Partners Real Estate, Austin Office | Q1 2026 | Quarterly Market Report, Apr 21, 2026.
- Four Points News, Former 3M site will continue to be R&D site, not a data center, Apr 30, 2026.
- CRE Daily, Austin Office Sublease Glut Eases as Big Blocks Linger, May 7, 2026.
- Partners Real Estate, Austin Office Q2 2025 Quarterly Market Report, Jul 2025.
- Partners Real Estate, Austin Office | Q4 2025 | Quarterly Market Report, Jan 16, 2026.
- Community Impact, Waterline, Texas' new tallest tower, tops out in Austin, Jul 31, 2025.
- Bisnow, Austin's Office Slump Is Fueling Mixed-Use Projects, Sep 30, 2026.
- CommercialCafe, Austin Office Rent Price & Sales Report (Yardi Research), Jan 2026 (2025 data).
- Green Street, Commercial Property Plods Along (Commercial Property Price Index press release), May 6, 2026.
- ECR (Equitable Commercial Realty), Austin CRE Market Update - April 2026, May 14, 2026.
- JLL Newsroom, Central Austin office property sold to The City of Austin for $26M, May 14, 2025.
- The Real Deal, Round Rock School District Pays $38M for Austin-Area Office, Apr 3, 2025.
- The Real Deal, Travis County Hospital District Buys North Austin Office, Dec 29, 2025.
- U.S. SEC (EDGAR), Artivion Inc. Exhibit 10.1, Real Estate Purchase and Sale Contract, 1300 E. Anderson Lane, Sep 26, 2025 (contract).
- Commercial Property Executive, Hines Pays $151M for Austin Asset, Jul 14, 2026.
- Commercial Property Executive, Cousins Properties Sells Austin Office Asset for $208M, Jul 31, 2026.
- Commercial Property Executive, KBS Sells Austin Office Tower, Sep 2026.
- Connect CRE, KBS Sells 26-Story Austin Office Tower, Sep 24, 2026.
- Hoodline, Private Austin Investor Buys 823 Congress Office Tower, May 27, 2026.
- Four Points News, SB Energy purchases former 3M campus at River Place Blvd., Mar 31, 2026.
- CBRE, Austin Office Figures - Q1 2026, Apr 9, 2026.
- Hoodline, PNC Moves Austin Headquarters To ATX Tower With Crown Signage, Apr 2026.
- Apollo Global Management, Apollo Selects Austin for Strategic Hub for Talent, Innovation and Long-Term Growth, Aug 3, 2026.
- Board of Governors of the Federal Reserve System, Federal Reserve issues FOMC statement (September 16, 2026), Sep 16, 2026.
- Board of Governors of the Federal Reserve System, H.15 Selected Interest Rates (Daily), October 2, 2026, Oct 2, 2026.
- Commercial Property Executive, Sale-Leaseback or Commercial Loan: Which Path Works Best in 2026?, Jun 3, 2026.
- City of Austin, Austin City Council Approves $6.6 Billion Budget for Fiscal Year 2026-2027, Aug 12, 2026.
- City of Austin, Austin City Council Approves Amended Fiscal Year 2025-2026 Budget, Nov 20, 2025.
- KUT, Travis County set to decide if Central Health can raise taxes to support mental health initiatives, Sep 14, 2026.
- Travis County, Notice of Public Hearing and Vote on Tax Increase (Travis County Healthcare District / Central Health, 2026), Aug 2026.
- U.S. Bureau of Labor Statistics, Austin-Round Rock-San Marcos, TX Economy at a Glance, Sep 2026 (Aug 2026 data, preliminary).
- Opportunity Austin (Austin Chamber), Relocations & Expansions, accessed Oct 5, 2026.
- U.S. Census Bureau, Slow Growth Impacts Nation's Largest Counties Hardest (Vintage 2025 estimates), Mar 26, 2026.
- The Boulder Group, Net Lease Market Report Q2 2026, Jul 2026.
- Commercial Property Executive, 2026 Office Net Lease Sales Volume and Cap Rates (Northmarq / RCA data), Jul 24, 2026.
- CBRE, Net-Lease Investment Volume Rises in Q2 2026, Extending Broad Market Momentum, Aug 13, 2026.
- REBusinessOnline, Lee & Associates' Q2 Report: Office, Retail Markets Gain Momentum..., Aug 6, 2026.
- Stock Titan (summary of SEC 8-K), AORT 8-K Filings - Artivion, Inc., Sep 29, 2025.
- Hoodline, ACC Buys $130.5M Site Near Austin Airport For Infrastructure Academy, Apr 2026.
- City of Round Rock, City Property Taxes, accessed Oct 5, 2026.
- CitizenPortal.ai, Round Rock ISD sets 2025 tax rate, approves tax-anticipation note and board nominations, Sep 18, 2025.
- Williamson County, Williamson County Approves FY25-26 Budget and Sets Tax Rate, Sep 4, 2025.
- OpenStreetMap Foundation, Nominatim geocoding search API (OpenStreetMap data), accessed Oct 5, 2026.
- NAI Excel, Outlook 2026 Commercial Real Estate Market Report, Austin (Vol. 37), Feb 2026.
- AQUILA Commercial, How Much Does It Cost to Lease Office Space in Austin, Texas?, Aug 20, 2026.
- eCFR (National Archives), 13 CFR 120.131 Leasing part of new construction or existing building to another business, current as of Oct 5, 2026.
- Cushman & Wakefield, Office Fit Out Cost Guide Americas 2026, Mar 2026.
- Cushman & Wakefield, Office Fit-Out Costs Across the Americas Rise 5.5%... (2026 Cost Guide press release), Mar 26, 2026.
- U.S. General Services Administration, GSA announces public sale by auction of office condominium in Austin, Mar 21, 2025.
- U.S. General Services Administration, GSA Sells $3.49M Office Condominium in Austin, Jul 28, 2025.
- Hoodline, Artivion Buys Austin Manufacturing Campus for $20.3M, Mar 2026.
- Coy Davidson (blog), Texas Office Market Snapshot - Q2 2026, Jul 20, 2026.
- Community Impact, Austin City Council OKs $26M office purchase, Apr 25, 2025.
- CommercialCafe, Austin, TX Office Buildings for Sale (listing page), accessed Oct 5, 2026.
- MetroTex Association of Realtors, Fact or Fiction: Must I Report Sales Prices to the MLS?, May 30, 2023.
- AQUILA Commercial, 2025 Recap: 5 Largest Office Building Sales in Austin, Texas, Jan 9, 2026.
- Commercial Property Executive, CRE Transactions in the Southwest (Week of September 28 / October 5, 2026), Oct 2026.
- SomerCor (CDC), September 2026 SBA 504 Interest Rates, Sep 10, 2026.
- Growth Corp (CDC), SBA 504 Rate Pricing, Sep 2026.
- Select Commercial Funding, Commercial Mortgage Rates Start at 6.40%, October 5, 2026, Oct 5, 2026.
- U.S. Small Business Administration, 7(a) loans, accessed Oct 5, 2026.
- Commercial Loan Direct, Commercial Loan Rates & Key Mortgage Indexes, Oct 5, 2026.
- Federal Reserve Bank of St. Louis (FRED), 10-Year Treasury Constant Maturity Rate (DGS10), Oct 2, 2026.
- Austin ISD, Taxpayer Impact Statement, Tax Year 2026, Sep 2026.
- Travis County, Fiscal Year 2026 - Tax Year 2025 Travis County Taxpayer Impact Statement, 2025.
- Travis County, Notice of Public Hearing on Tax Increase (Travis County, 2026), Sep 4, 2026.
- Austin Community College, ACC Approves New Property Tax Rate For FY25-26, Sep 16, 2025.
- Austin Current, Austin property tax rates rise, but some bills may fall, Oct 5, 2026.
- Capital CDC, SBA 504 Loans, accessed Oct 5, 2026.
- eCFR (National Archives), 13 CFR Part 120 Subpart H, Development Company Loan Program (504), incl. 120.801, current as of Oct 5, 2026.
- U.S. Small Business Administration, 504 loans, accessed Oct 5, 2026.
- Board of Governors of the Federal Reserve System, July 2026 Senior Loan Officer Opinion Survey on Bank Lending Practices, Aug 3, 2026.
- O'Connor & Associates, Travis County Taxable Value Increased by $17.26 Billion in 2026, Apr 10, 2026.
- O'Connor & Associates, Successful ARB Hearings Improve 2025 Travis County Property Tax Appeal Results, Oct 6, 2025.
- Austin Community College, ACC District & Service Area, accessed Oct 5, 2026.
- IRS, Publication 946 (2025), How To Depreciate Property, 2025 edition.
- IRS, Treasury, IRS issue guidance on the additional first year depreciation deduction amended as part of the One, Big, Beautiful Bill (IR-2026-06, Notice 2026-11), Jan 14, 2026.
- PwC, OB3 provides bonus depreciation, qualified production property, 2025.
- IRS, Cost Segregation Audit Techniques Guide (Publication 5653), Feb 2025 revision.
- Plante Moran, OBBB boosts U.S. manufacturing through new qualified production property deduction, Nov 2025.
- Current Federal Tax Developments, 2026 Inflation Adjustments for Tax Professionals: Revenue Procedure 2025-32 Analysis, Oct 9, 2025.
- Marsh, US Insurance Rates (Global Insurance Market Index, Q2 2026), Jul 2026.
- Insurance Journal, Q2 Global Commercial Insurance Rates Keep Dropping, Except for US Casualty, Jul 23, 2026.
- SLB Capital Advisors, Sale Leaseback Transactions: Frequently Asked Questions, updated May 11, 2026.
- ECR (Equitable Commercial Realty), Austin Commercial Real Estate Market Report (Office, Q2 2026), Jul 22, 2026.
- CBRE, U.S. Cap Rate Survey H1 2026, Aug 12, 2026.
- Commercial Property Executive, Sale-Leaseback Deals Slide, Even as STNL Investment Grows (Newmark data), Sep 21, 2026.
- W. P. Carey (SEC EDGAR), W. P. Carey 4Q25 Investor Presentation, Feb 2026.
- IRS, Like-kind exchanges - real estate tax tips, accessed Oct 5, 2026.
- IRS, Instructions for Form 8824 (2025), 2025.
- Travis Central Appraisal District, 2026 Market Values On Their Way To Travis County Property Owners, Mar 25, 2026.
- CBRE, Office Building Owners Offering Fewer Concessions to Tenants, Mar 6, 2025.
- CBRE, Growth of Office Effective Rents Limited by Record-High Concessions, Dec 20, 2023.
- Texas Comptroller of Public Accounts, Franchise Tax, accessed Oct 5, 2026.
Figures are as published by each source for the period shown; brokerages define inventory and submarkets differently. Map reference points from OpenStreetMap. Market data current to October 5, 2026.
Download the model (.xlsx)